Nếu việc phải tự viết code cho mọi thứ khiến bạn cảm thấy quá tải, hoặc việc quản lý một kho dữ liệu với hàng loạt script phức tạp là điều vượt quá sức chịu đựng, bạn không hề đơn độc. Hướng dẫn xây dựng luồng dữ liệu trong Microsoft Fabric này – từ nguồn dữ liệu đến dashboard – sẽ giúp bạn đơn giản hóa quy trình với lượng code tối thiểu.
Nhiều đội ngũ, đặc biệt là các nhóm dữ liệu nhỏ hoặc người dùng không chuyên, thường gặp khó khăn với các vấn đề như:
- Viết và bảo trì mã ETL phức tạp
- Gỡ lỗi luồng dữ liệu chạy qua nhiều nền tảng khác nhau
- Đảm bảo dashboard báo cáo luôn đồng bộ với dữ liệu gốc
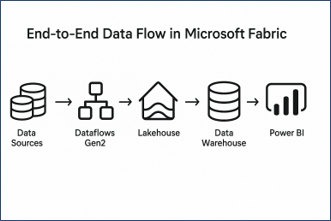
Giới thiệu: Luồng dữ liệu end-to-end trong Microsoft Fabric
Khám phá các tính năng cốt lõi
- Trải nghiệm no-code đến low-code: Microsoft Fabric mang đến giao diện trực quan, phù hợp cho mọi đối tượng người dùng, dù bạn có nền tảng kỹ thuật hay không. Việc tạo dựng Data Flow trong Microsoft Fabric trở nên đơn giản hơn bao giờ hết mà không cần phải viết nhiều mã.
- Quy trình dữ liệu hoàn chỉnh: Nền tảng này xử lý toàn bộ quy trình, từ trích xuất dữ liệu cho đến trực quan hóa, giúp bạn quản lý hiệu quả toàn bộ pipeline dữ liệu chỉ trên một hệ thống duy nhất.
- Từ nguồn đến báo cáo: Dữ liệu được chuyển trực tiếp từ nhiều nguồn khác nhau đến các công cụ báo cáo cuối cùng, giảm độ trễ và nâng cao khả năng truy cập dữ liệu cho người dùng.
- Kết nối nguồn dễ dàng: Fabric hỗ trợ tích hợp mượt mà với nhiều nguồn dữ liệu, mang lại sự linh hoạt tối đa trong việc thu nạp dữ liệu và xây dựng Data Flow trong Microsoft Fabric.
Để tìm hiểu thêm về kiến trúc tổng thể của Microsoft Fabric, bạn có thể tham khảo các tài liệu chính thức của Microsoft.
Bước 1 – Tạo luồng dữ liệu (Gen2)
Chiến lược triển khai để trích xuất dữ liệu hiệu quả
- Trích xuất từ nhiều nguồn khác nhau: Bạn có thể lấy dữ liệu từ các cơ sở dữ liệu, API hoặc các file phẳng (flat files). Việc này giúp tạo ra một cái nhìn phân tích toàn diện.
- Sử dụng REST API: Các RESTful API giúp đơn giản hóa việc trao đổi dữ liệu giữa Microsoft Fabric và các hệ thống bên ngoài.
- Biến đổi dữ liệu với Power Query: Power Query cung cấp bộ công cụ mạnh mẽ để làm sạch và biến đổi dữ liệu trước khi tải vào hệ thống. Bạn có thể tìm hiểu thêm về các phép biến đổi trong Power Query để tận dụng tối đa khả năng này. Tìm hiểu thêm về Power Query.
- Chọn Lakehouse làm điểm đến: Lakehouse cho phép lưu trữ cả dữ liệu thô và dữ liệu có cấu trúc trong cùng một nơi. Đây là lựa chọn lý tưởng cho kiến trúc kiểu on-premise nhưng chạy trên nền tảng đám mây.
Các bước triển khai
Bước 1: Dataflow Gen2 hỗ trợ tải dữ liệu vào Lakehouse, Warehouse và có thể sử dụng trong các pipeline tự động hóa.
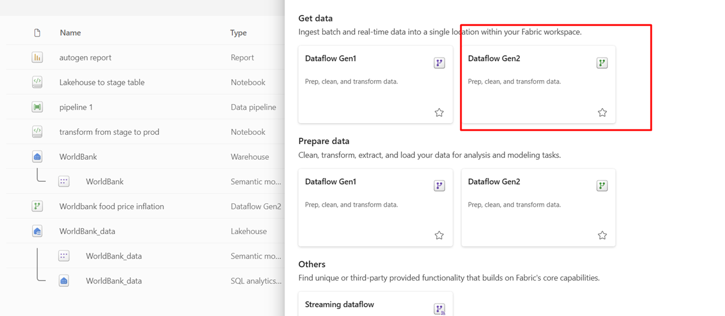
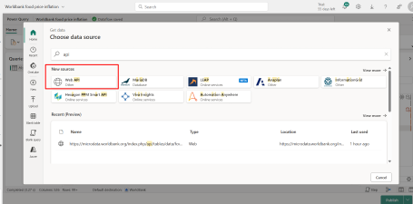
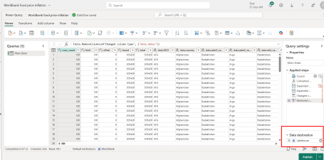
Bước 2: Chọn nguồn dữ liệu và sử dụng Power Query để biến đổi như bình thường. Trong ví dụ này, tôi chọn API công khai (public API).
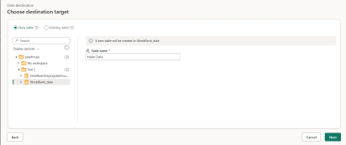
Bước 3: Sau khi hoàn tất các bước biến đổi, chúng ta sẽ xác định điểm đến dữ liệu. Ở đây, chúng ta sẽ sử dụng điểm đến linh hoạt (Flexible destination) với Lakehouse. Bạn có thể xuất bản Dataflow mà chưa chọn điểm đến ngay. Sau đó, trong bước tiếp theo, chúng ta sẽ tạo Lakehouse và thêm điểm đến đó vào bước 2.
Step 2 – Configure Lakehouse
Structuring Your Data Storage Effectively
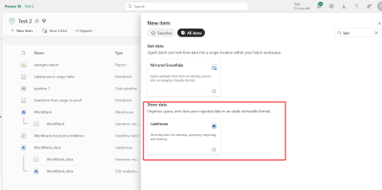
- Create Lakehouse in Fabric workspace: Establishing a Lakehouse within a designated workspace within Fabric ensures that all stakeholders have easy access to the data and project tools.
- Select Lakehouse as destination: Choosing the Lakehouse as a destination for incoming data flows reinforces the duality of accommodating unstructured data while optimizing structured queries.
- Ensure unique column names: Maintaining unique column identifiers within the data schema is crucial for preventing data conflicts and ensuring clarity in data operations.
- Choose Append or Replace mode: Selecting between Append and Replace modes provides flexibility in data management, impacting historical data integrity and accessibility during updates.
Implementation Steps
Step 1: Lakehouse is more friendly to load data from dataflow and more suitable for raw data. We can load not only structured data but also files and non structured data
Step 2: We choose data destination in the dataflow we created before
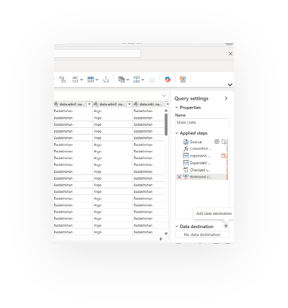
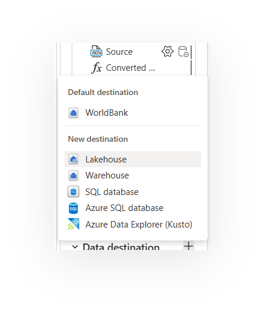
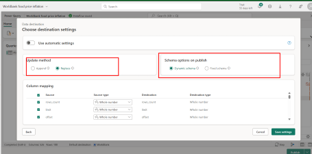
Step 3: Continue define table name and schema of target table in Lakehouse. Avoid duplicate columns name. Choose append or replace mode
Step 3 – Explore the Lakehouse
Navigating and Utilizing Your Data Landscape
- Navigate to Lakehouse: Users can easily locate and interact with the Lakehouse interface, from which various data operations can be initiated.
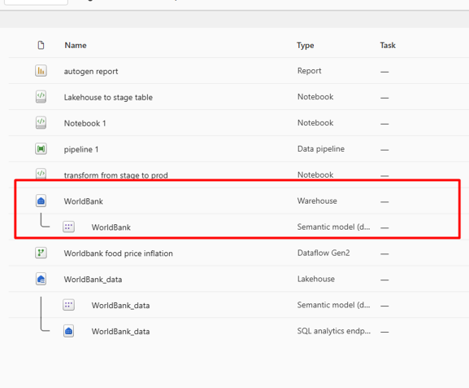
- Confirm table creation: Verifying the successful creation of tables within the Lakehouse is vital for subsequent querying and analytical tasks.
- Query using SQL Analytics: Employing the SQL Analytics Endpoint allows for robust querying capabilities, enabling users to perform advanced SQL operations to extract meaningful insights from the data stored in the Lakehouse.
- Build dashboards via Semantic Models: These models support intuitive and quick insights using Microsoft Fabric data flows.
- Optionally move subset of data table to Warehouse: To optimize the process, it is recommended to store analytics data in a separate warehouse to dedicate for analysis and reporting activities
Step 4 – Create & Use a Warehouse
Structured Storage for Analytical Data:
- Create a Warehouse: Warehouses are ideal for storing cleaned data for analytics. It complements your approach to building data flow in Microsoft Fabric.
- Use Notebook to copy transformed data from Lakehouse to Warehouse
Step 5 – Aggregate Data with Notebook
Leveraging Notebooks for Data Transformation
- Create Notebook for data transformation: Notebooks serve as interactive environments for performing data transformations, enabling exploration and experimentation with data.
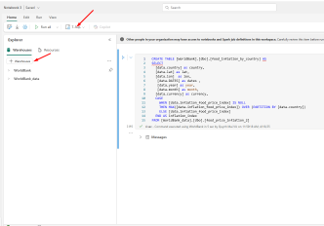
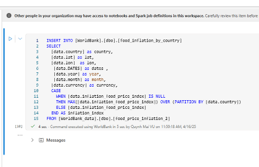
- Use T-SQL: The easiest way to query data from two warehouse:
- Choose T-SQL and add warehouse and lakehouse
- In syntax box, you first run a create statement. Here I run it from the query that I would like to take the output to insert into the Warehouse analytics table
- After the table created, I changed the CREATE TABLE syntax to INSERT INTO, so everytime I run the notebook, it will insert the ouput to the analytics table
Step 6 – Semantic Model & Reporting
Interpreting Data through Effective Visualization
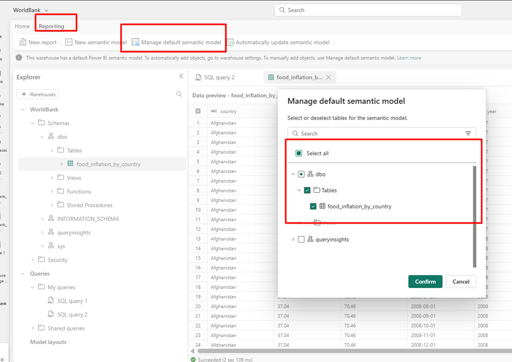
- Confirm Semantic Model: Validating the semantic model ensures that it accurately reflects the underlying data structures and enables effective querying.
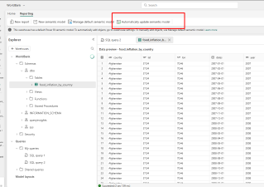
- Enable automatic updates: Configuring automatic updates for the semantic model guarantees that any changes in the data model are reflected instantly in reports and dashboards.
- Customize reports in Power BI: Power BI’s flexibility promotes the development of tailored reports, enabling stakeholders to visualize data relevant to their specific analytic needs.
Implementation Steps
Step 1: Click Reporting 🡪 Manage default semantic model 🡪 Confirm
Step 2: Automatically update semantic model
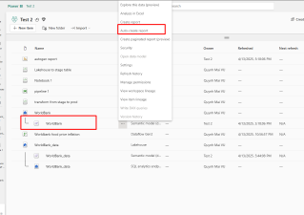
Step 3: Click on Semantic model 🡪 Auto create report
Step 4: You will be redirected to the interface where the report is already auto-generated. Simply save it to your workspace to continue customizing it as needed. You can also download it to Power BI Desktop and use it as usual.

Final Step – Full Automation
Streamlining Data Flows for Efficiency
- Add Dataflow & Notebook & Semantic Model to Pipeline: Integrating Notebooks into data pipelines automates data transformation processes, minimizing manual intervention and enhancing productivity.
- Schedule the pipeline: Routine checks on staging tables to confirm the accuracy of data before further processing help maintain data quality and reliability.
Implementation Steps
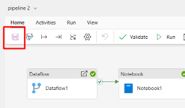
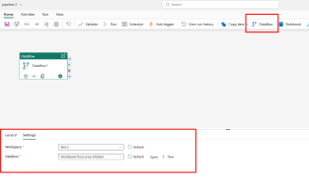
Step 1: Create a pipeline on workspace
Step 2: Add Dataflow and point the setting to dataflow you created
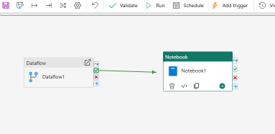
Step 3: Add Notebook and connect Dataflow to Notebook when Dataflow success. Press the success button and pull to Notebook bloc
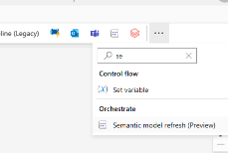
Step 4: Add Semantic Model as the last bloc. You will also pull relationships like previous steps. To have semantic model, go to Activites tab 🡪 Three dots and find
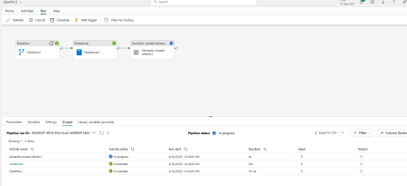
Step 5: On Run tab, click “Run” and wait for the progress
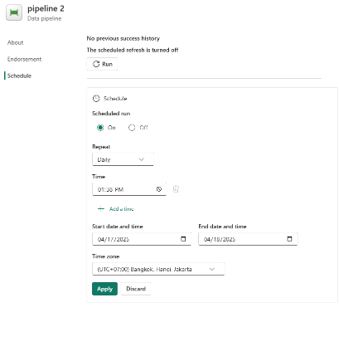
Step 6: On Run tab, click “Schedule” and setup your schedule
Step 7: On Home tab, click “Save”